^GSPC -0.38% Stocks hit a volatile patch over the past week, with the S&P 500 Index (SPX) falling more than 4% last Thursday, followed by a quiet Friday and then a 2.3% gain on Monday. Options buyers were already stocking up on puts.
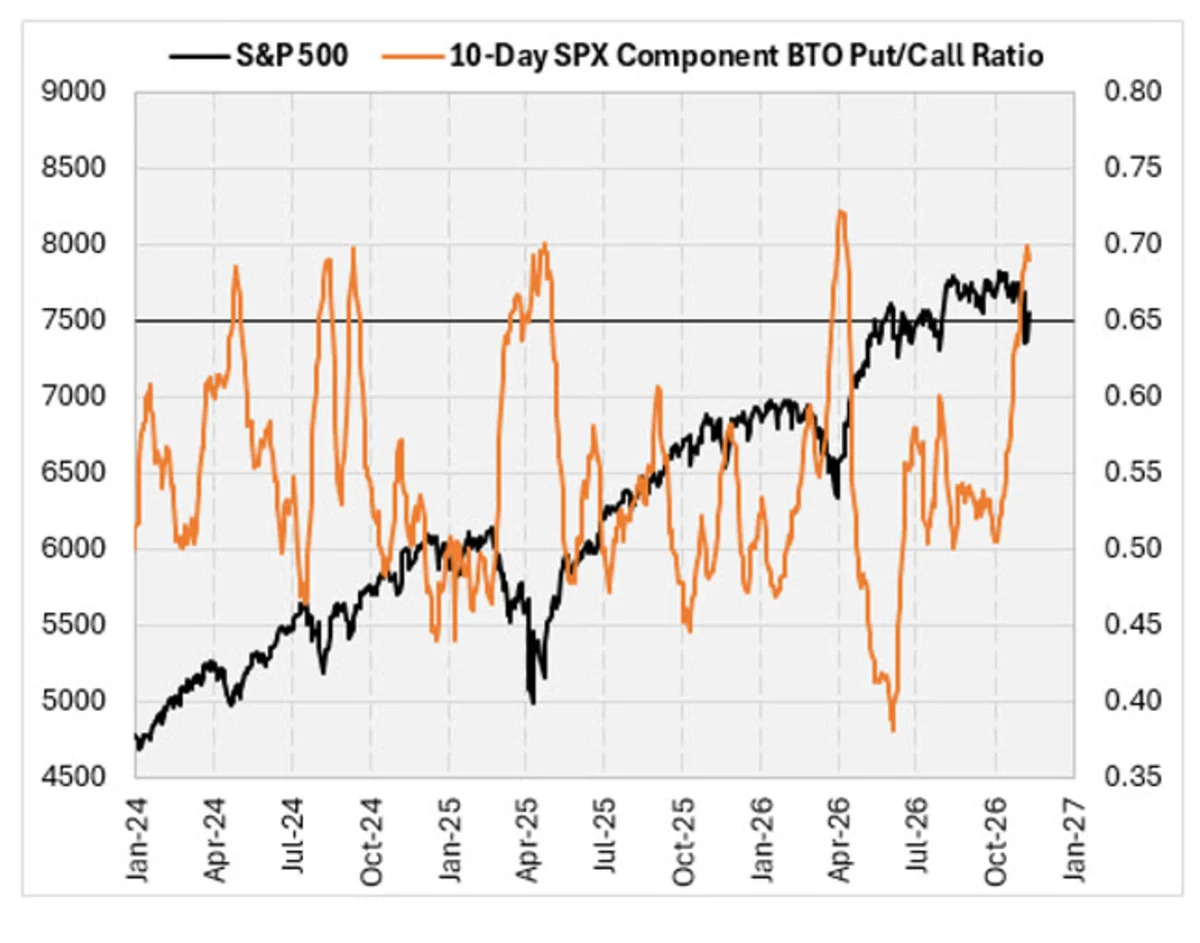
The chart below shows the 10-day buy-to-open (BTO) put/call ratio on SPX component stocks. Eyeballing the chart, sharp spikes in the ratio, like the one now, have marked significant low points for the index. Whether the put buying is speculative or hedging-related, the rise in bearish options activity could be a bullish signal for stocks. In this article, I'll examine past spikes to see exactly what the numbers tell us.
For the data below, I used current S&P 500 stocks to find the 10-day BTO put/call ratio going back to 2016. I identified instances when the ratio spiked above 0.65, with each signal representing the first reading above that level in at least a month.The table below summarizes SPX returns after the signals.
The latest signal occurred two Fridays ago (Oct. 30), just before last week's mayhem. When you look at the average returns, the SPX tended to underperform, averaging a 0.62% return in the month following a signal, compared to a typical 1.18% return since 2016. The median return, however, shows a higher return than normal.
What we find is the average return figures below are skewed by a signal that occurred just before the COVID-19 crash in March of 2020. When you get rid of that one data point, you see average returns for those short-term readings of 0.09% (1-week), 1.57% (2 weeks), 2.03% (1 month). Those last two readings easily outperform the typical returns. In other words, get rid of one bad signal, and it's a bullish indicator.
This next table shows the dates of the individual signals and the subsequent SPX returns. I bolded the March of 2020 signal that i mentioned earlier. Disregarding that signal, there were three other times the SPX lost at least 2% in the week following a signal. After the August 2023 signal, the index almost got to breakeven at the one-month mark. The other two instances occurred in May and August of 2019, with the SPX gaining 3.1% and 1.4%, respectively, a month after those signals.
I did a similar analysis using Nasdaq-100 Index (NDX) components. For the signal, I used a spike of the 10-day BTO put/call ratio above 0.70 instead of 0.65. That makes the latest signal for NDX stocks occurring last Wednesday (Nov. 4).
The table below summarizes the NDX returns after these signals. The returns are very bullish when you look at the average for any of those time frames. There has tended to be considerable upside after these signals based on the average positive figures (the average return of just positive returns).
Finally, here are the individual signals of the NDX component 10-day BTO put/call ratio spiking above 0.70. The two most recent signals led to one-month returns of more than 17%.
Intuitively, I would expect a spike in put buying to have bullish implications going forward. Based on that and the analysis above, I think the odds favor bullish returns over the short to medium term.