Earnings Breadth Hits Near-Record Highs, But Cracks Emerge at the Margins Wall Street Horizon Mon, November 9, 2026 at 8:25 AM EST 5 min read AAPL +0.63% Trade Apple on Coinbase Trading disclosure Trading disclosure The above button links to Coinbase. Yahoo Finance is not a broker-dealer or investment adviser and does not offer securities or cryptocurrencies for sale or facilitate trading. Coinbase pays us for certain activity generated through this link. Prices displayed are informational.
Nearly 2-to-1 EPS increases vs. decreases thus far in Q3, with 63% of reporting companies topping their prior EPS print, well above the 54% historical baseline.
While mega-caps like Apple and cloud giants delivered solid top-line revenue, rising memory chip and AI infrastructure expenses triggered selective post-earnings selloffs.
Diverging restaurant earnings reveal an increasingly two-tier economy, where fast-casual brands thrive on affluent spend while traditional quick-service chains face foot-traffic pushback from lower-income diners.
Apple (AAPL) opened the second peak week of Q3 earnings season by topping estimates with $114.48 billion in revenue and earnings per share of $2.10, driven by double-digit hardware and services growth. However, the initial market reception was cold, with shares sliding roughly 3% as forward gross margin projections between 45% and 46% reflected mounting pressure from rising memory chip costs.1
Broader equity sentiment remained volatile following Tuesday's midterm election results, which confirmed a Democratic sweep of both the House and Senate and ushered in a divided government starting in 2027. Investors initially celebrated the prospect of legislative gridlock, which traditionally blocks disruptive tax hikes or sweeping policy changes, fueling a sharp post-election rally led by consumer discretionary, communication services, and mega-cap technology, while falling crude oil prices weighed on traditional energy. By Thursday the Nasdaq was under pressure as AI stocks fell on the belief that the data center buildout will take a hit under new leadership, recording its biggest one day drop (-5.5%) in 19 months.
Last week's restaurant earnings gave us an early look at the American consumer. Traditional fast-food giants relying on lower-to-middle-income diners struggled to drive foot traffic: McDonald's (MCD) saw U.S. same-store sales slip 0.2% and overall revenues missed estimates2, Yum! Brands (YUM) missed revenue estimates despite Taco Bell's relative resilience3, and Papa John's (PZZA) tumbled after a double-digit revenue drop4, illustrating how quick serve restaurants (QSR) continue to struggle in this environment. Fast-casual name Shake Shack (SHAK) grew top-line sales 15%, but still missed estimates. EPS of $0.40 beat expectations, Same Shack Sales were up 2.5% marking the 23rd quarter of positive comps, and guidance was better than expected.5 While this may underscore that higher-income demographics are still willing to spend on premium dining experiences while lower-to-middle income customers continue to hold back, SHAK's stock was down 6% in the following trading session.
Now with 88% of S&P 500 companies reporting, the blended EPS growth rate moved higher to 31.4% last week, from 30.2% the week prior. Revenue growth also saw a bump to 14.3% from 13.1% in the week prior.6 This week 13 S&P 500 components are set to report results.
Notice in the chart below that the ratio of earnings growers to decliners is almost 2-to-1. Only one month into the Q3 earnings season (companies reporting in CQ4) and 63% of companies have reported EPS results that are higher than their previous print (either quarterly or semiannually). The only other recent quarters reporting higher instances of EPS increases were seen last quarter during the Q2 2026 reporting season when 68% of EPS reports were higher, and in Q3 2025 which had an increase percentage of 66%. The long-term average for EPS increases (going back to 2018) is 54%.
Near Record-High Ratio of EPS Increases to Decreases*
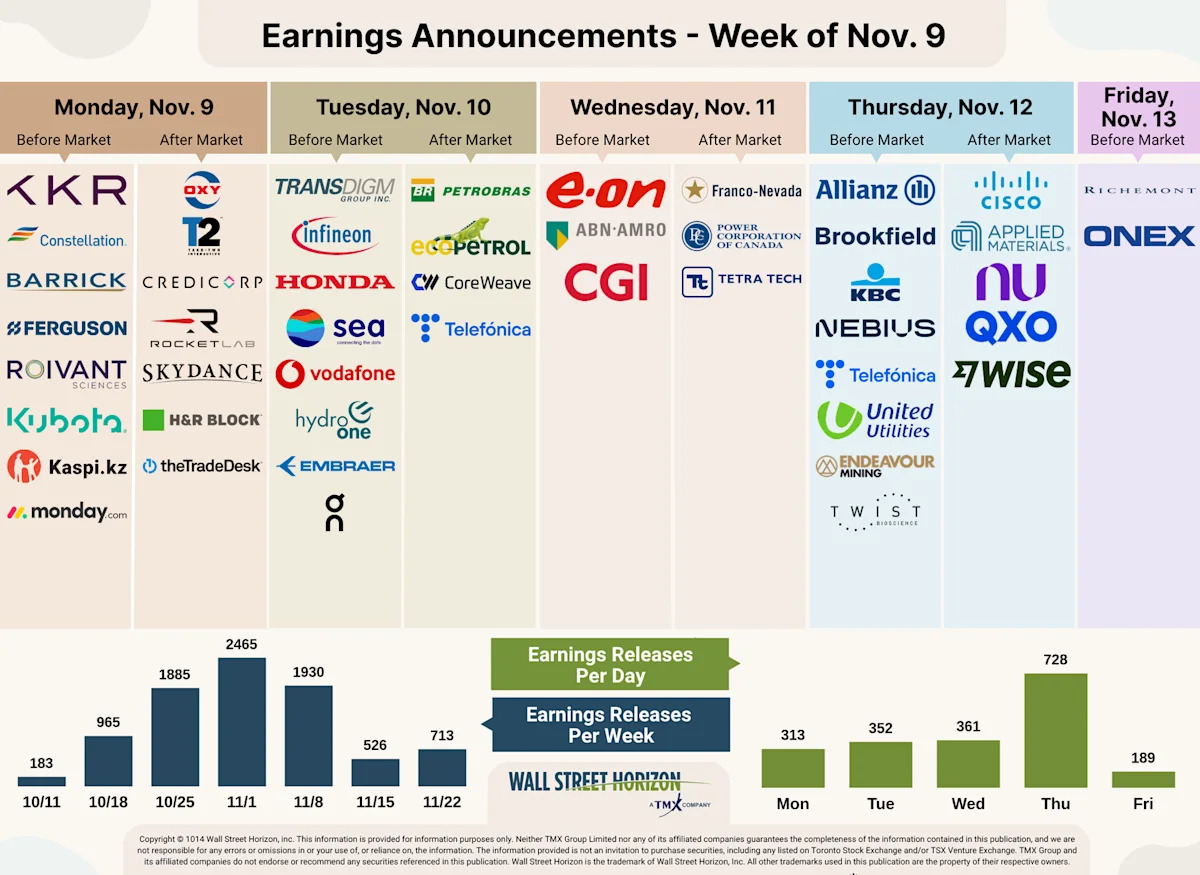
This marks the final peak week of the Q3 earnings season with 1,930 companies expected to report. Thus far, 88% of companies have confirmed their earnings date, and 55% have reported (out of our universe of 11,000+ global names). The remaining dates are estimated based on historical reporting data.
Despite some volatility caused by the midterm elections last week, mega-cap cash flows remain resilient, earnings continue to come in better-than-expected, and corporate balance sheets remain fundamentally sound even as late-cycle pressures emerge. However, mounting margin scrutiny in tech and diverging restaurant foot traffic signal that corporate pricing power and the lower-income consumer are reaching their limits. Heading into the final peak wave of the reporting season, the market's continued upward momentum will depend on whether that solid earnings breadth can offset selective consumer pullbacks and sustain double-digit growth.
1 Apple Fourth Quarter 2026 Earnings Results, November 2, 2026, https://www.apple.com2 McDonald's Third Quarter 2026 Earnings Results, November 4, 2026, https://corporate.mcdonalds.com3 Yum! Brands Third Quarter 2026 Earnings Results, November 3, 2026, https://s2.q4cdn.com4 Papa Johns Third Quarter 2026 Earnings Results, November 5, 2026, https://ir.papajohns.com5 Shake Shack Third Quarter 2026 Earnings Results, November 5, 2026, https://investor.shakeshack.com6 FactSet Earnings Insight, John Butters, November 6, 2026, https://advantage.factset.com
Copyright © 2026 Wall Street Horizon, Inc. All rights reserved. Do not copy, distribute, sell or modify this document without Wall Street Horizon's prior written consent. This information is provided for information purposes only. Neither TMX Group Limited nor any of its affiliated companies guarantees the completeness of the information contained in this publication, and we are not responsible for any errors or omissions in or your use of, or reliance on, the information. This publication is not intended to provide legal, accounting, tax, investment, financial or other advice and should not be relied upon for such advice. The information provided is not an invitation to purchase securities, including any listed on Toronto Stock Exchange and/or TSX Venture Exchange. TMX Group and its affiliated companies do not endorse or recommend any securities referenced in this publication. This publication shall not constitute an offer to sell or the solicitation of an offer to buy, nor may there be any sale of any securities in any state or jurisdiction in which such offer, solicitation or sale would be unlawful prior to registration or qualification under the securities laws of any such state or jurisdiction. TMX, the TMX design, TMX Group, Toronto Stock Exchange, TSX, and TSX Venture Exchange are the trademarks of TSX Inc. and are used under license. Wall Street Horizon is the trademark of Wall Street Horizon, Inc. All other trademarks used in this publication are the property of their respective owners.