Trump’s last midterm market got ugly — then stocks surged 12%. How a post-election pop can add a boost to your nest egg Brett Holzhauer Sat, November 7, 2026 at 8:15 AM EST 5 min read GC=F Moneywise and Yahoo Finance LLC may earn commission or revenue through links in the content below.
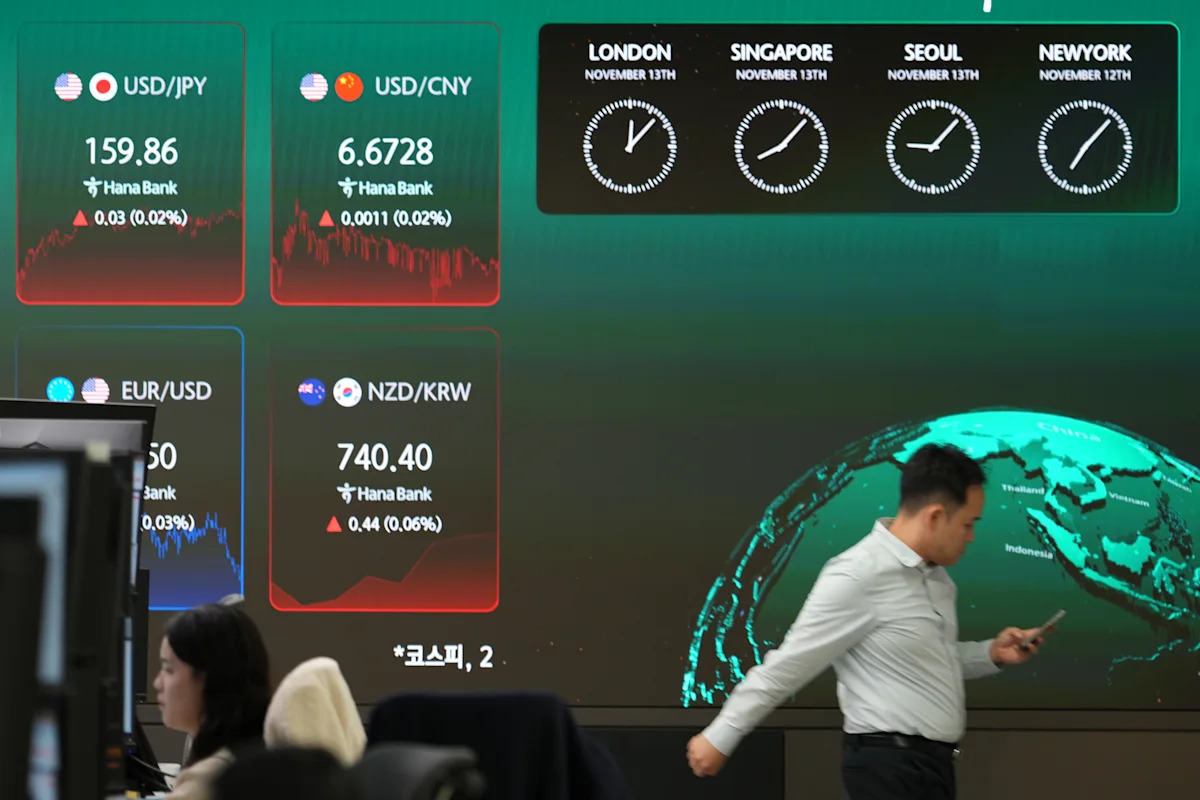
Markets have jostled in the wake of the Democrat-led blue tsunami in 2026's historic U.S. midterms — including a substantial $2.5 trillion plus wipeout on the Nasdaq (1).
Although the dust has yet to fully settle, the final weeks of the year and months after the midterms have historically delivered a pleasant surprise for investors.
Jeff Bezos backs a platform that lets anyone invest in rental homes for as little as $100 — 6 ways to build wealth like a landlord without actually being one
A single line on your car insurance policy could be inflating your premium by up to 30% — here's what to change
Gold has overtaken U.S. Treasuries as central banks' top reserve asset. Get Goldco's 2026 Precious Metals IRA Playbook for free
Since 1950, the market has been up six and 12 months post-midterm elections in 100% of cases, according to GNG Research (2). In fact, when Dems flipped the House during the last midterms held under President Donald Trump's in 2018, the S&P 500 was up about 11.7% by November of the following year — while other estimates place it slightly higher at 12.4% (3).
Here's what you need to know about the stock market volatility in reaction to the midterms, and how you can play it for the next year.
Many expected a blue wave in the midterms given President Trump's low approval ratings. What transpired was a massive blue shift as Democrats captured both the House and Senate, the first time both chambers of Congress flipped in the same midterm since 2006 (4).
But the last two trading sessions have shown two very different market sentiments. On Wednesday, markets roared ahead as post-election uncertainty eased. On Thursday, the selloff began amid fears the incoming House and Senate would push back against the tech industry. This market seesaw sent the VIX, the fear gauge for investors, into its biggest jump since April 2025 (5).
If you're looking for up-to-date investment information, including current investor sentiment, Moby can get you the news, research, and information to make the best stock picks possible.
In four years, and across almost 400 stock picks, their recommendations have beaten the S&P 500 by almost 12% on average. They also offer a 30-day money-back guarantee.
Plus, Moby's reports are simple to understand, even for the newest investor.
Skip 6 decades of reading: Get Warren Buffett's best investing lessons in 1 free guide
The stock market's future looks bright, and history is the teller. Since 1950, the S&P 500 has been up an average of 14.1% after six months and 15.1% after 12 months, per GNG Research (2). But not all of this can be attributed to post-election excitement alone.
Most notably, the six- and 12-month cycles post-midterm ended in positive territory in 100% of cases.
For those keeping a keen eye on the markets, historical data shows the time from election day to Dec. 31 is a weaker, but still above average, period averaging a 2.6% uptick. Meanwhile, the run-up to a midterm, starting Sept. 30, and ending on June 30 of the following year is the strongest part of this cycle — seeing a 20.1% average gain since 1950.
However, keep in mind that the path to positive territory isn't always smooth. Remember, in 2018, during President Trump's first term, the S&P 500 didn't turn positive until the six-month mark — but finished up 12.4% one year after the midterm.
Outside of midterms, November to April is historically the better six months to invest, compared to May through October (6). But trying to perfectly time the market — even with historical data in hand — can be risky. After all, past success doesn't guarantee future returns.
Another strategy, and one touted by many advisors, is to invest regularly regardless of how the market is performing, using a strategy called dollar cost averaging (7). The idea is that by putting the same amount of money into an investment every month, you capture profit from dips and don't have to chase peaks. If you always put $200 into an index fund tracking the S&P 500, for example, it almost doesn't matter where it falls on a given day, provided it goes up over time.
If you want to ride the highs and lows passively, you can get started with Acorns, an app that automatically invests your spare change. Every time you buy something on a linked credit or debit card, Acorns rounds up the total to the nearest dollar.
That money goes into a diversified portfolio of ETFs that you can tailor to your risk tolerance. Acorns also lets you invest in specific sectors of the economy through custom portfolios, including areas like healthcare, energy, consumer staples, and utilities.
You can also supercharge your savings with recurring monthly deposits, and begin building a nest egg for your future self. And if you sign up today with a $5 recurring deposit, Acorns will add a $20 bonus to help on your investment journey.
The tax breaks in Trump's 'big beautiful bill' expire after 2028. Here are 4 moves to make before the window closes
Vanguard reveals what's coming for U.S. stocks — and it could be bad news for this group of investors
Robert Kiyosaki issued grim warning for baby boomers. Many could be 'wiped out' and homeless 'all over' the country. How to protect yourself now
Dave Ramsey says this 1 indulgent purchase stops Americans from becoming wealthy. Here's what he recommends instead
We rely only on vetted sources and credible third-party reporting. For details, see our ethics and guidelines.
CNN (1); Gngresearch (2); X (3); New York Post (4); The Wall Street Journal (5); Fidelity Investments (6), (7)
This article provides information only and should not be construed as advice. It is provided without warranty of any kind.