In a normal market, an empty home is a wasting asset: Equity sits trapped, no rent comes in, and the owner keeps paying property taxes, insurance, maintenance, utilities, and fees.
But the math has started to bend the other way in some markets, according to a new analysis.
The study from Flock Homes, a real estate investment platform, found that in 49 metros, the modeled cost of keeping a vacant home for at least five years was lower than the estimated tax hit from selling.
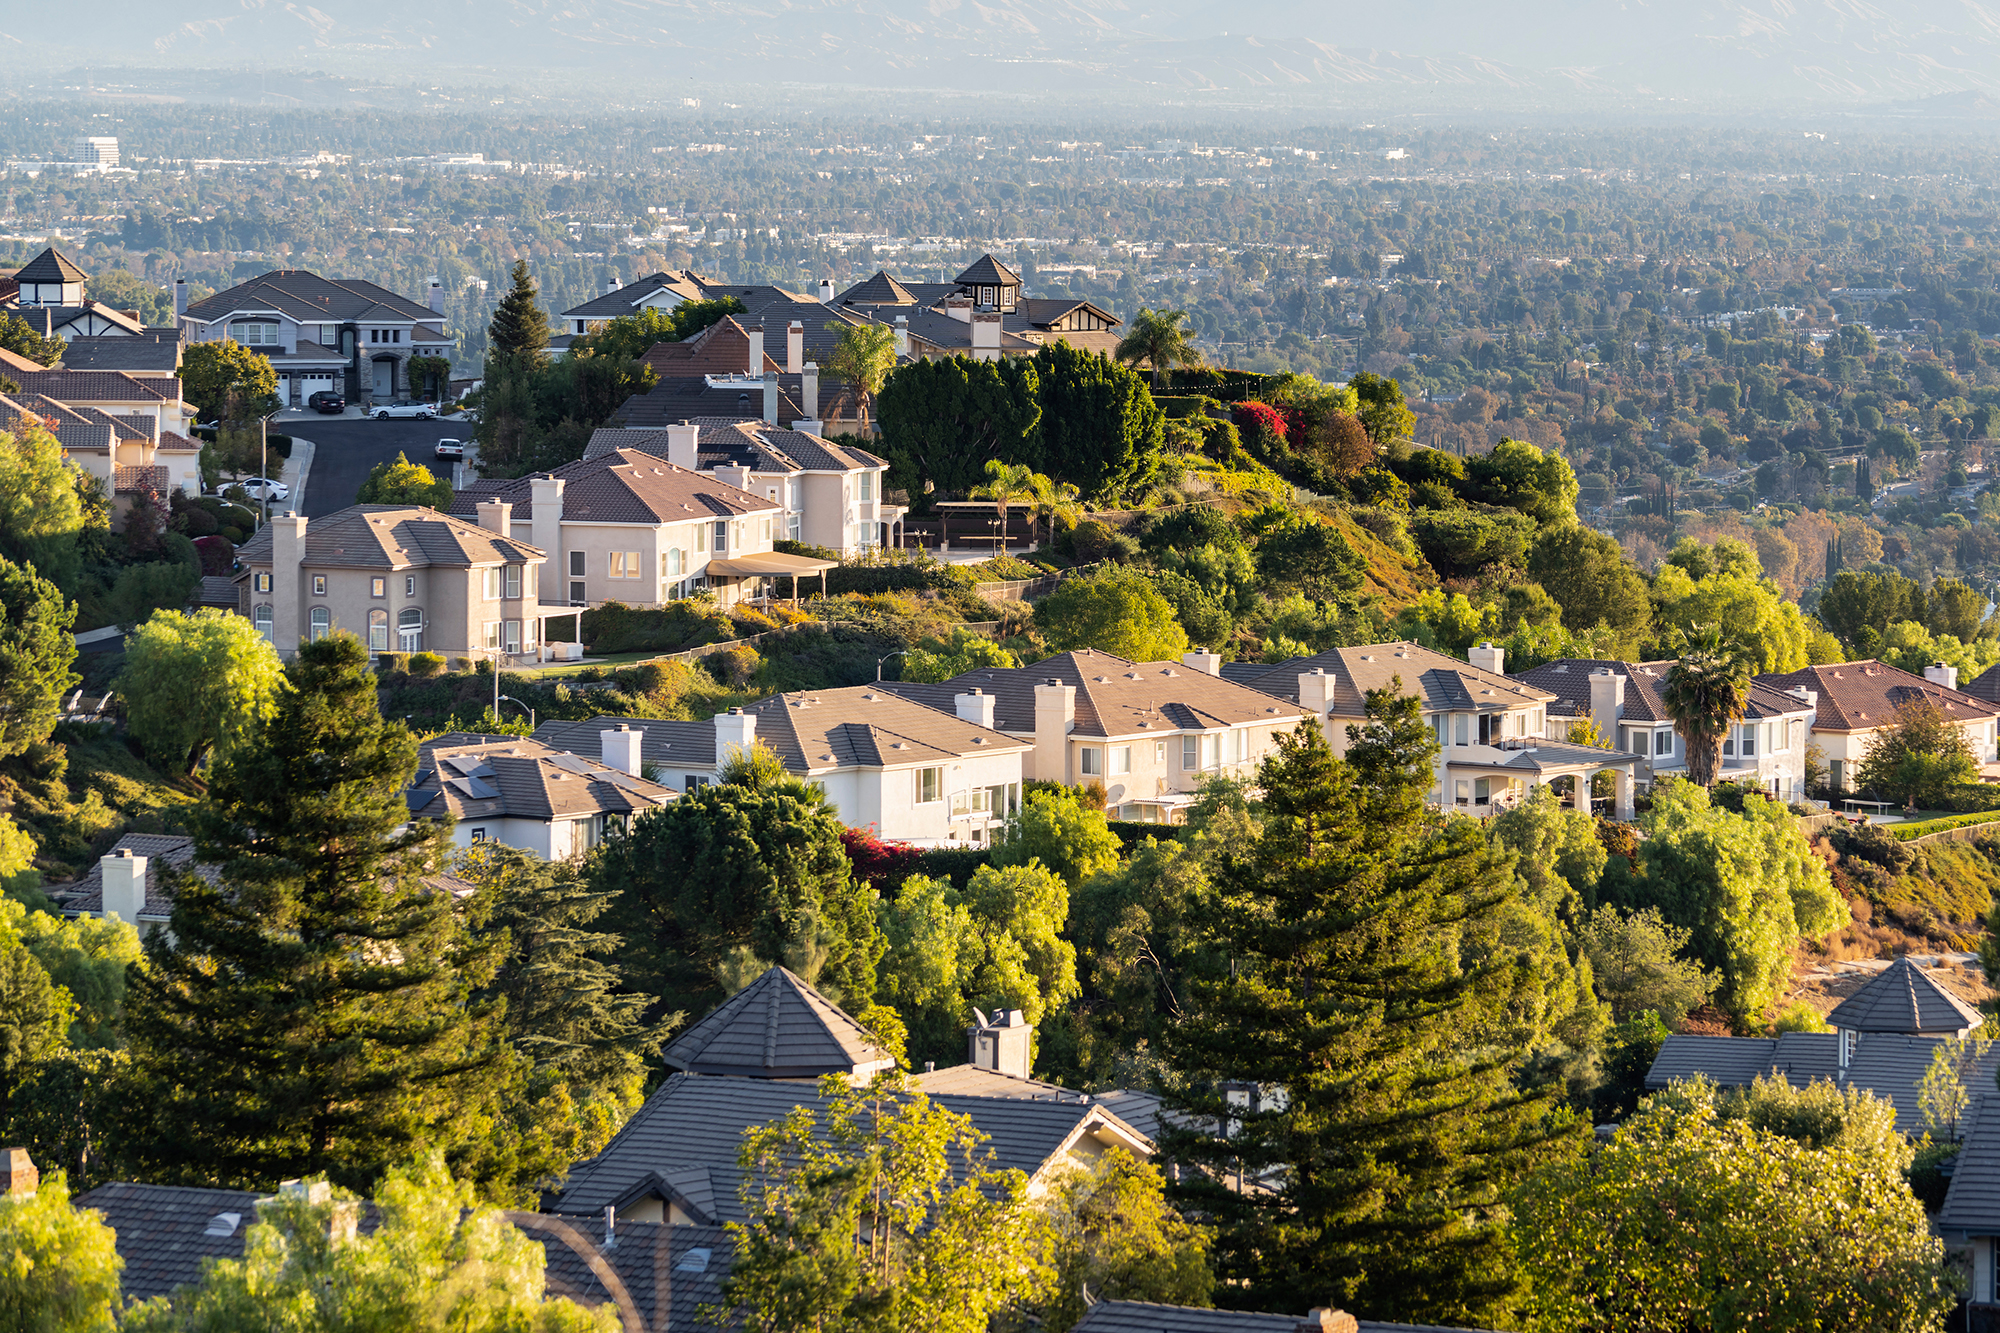
In Los Angeles, it would take nearly 19 years of holding costs before vacancy became more expensive than selling.
It’s a shocking finding because the logic runs counter to everything a housing shortage should reward: Even as home prices sit near historic highs and buyers are desperate for more listings, some owners may find that selling triggers a tax hit so large that holding on to an empty home makes more financial sense—keeping properties out of circulation when the market needs them most.
“Everyone knows that we have a ‘stuck’ real estate market right now,” says Kimberly Schmidt, a real estate agent in San Diego—where it takes 14.5 years of holding costs before vacancy becomes more expensive than selling, according to Flock’s analysis.
“We have 20% fewer homes on the market so far in 2026 than we did in 2025, and these long-term holds are most definitely part of the reason why,” she adds.
And now, with tax reform under debate at the federal and local levels, some owners may have even more reason to wait.
Flock’s analysis looks at two separate tax policies: capital gains tax and depreciation recapture.
It’s important to note, however, that these taxes don’t equally apply to every owner.
Capital gains tax is the more familiar and broadly applicable one.
This levy is applied to the profit an owner makes when a property sells for more than they paid for it.
Primary home sellers get some protection from that hit by excluding up to $250,000 in gains if they are single, or $500,000 if they are married and filing jointly, provided they meet ownership and use requirements.
But those exclusions haven’t kept pace with inflation, as previously reported by Realtor.com®, and today, nearly 29 million households have more equity than the current single-filer exclusion protects.
By 2030, 56% of homeowners will exceed that threshold.
Second homes and investment properties, meanwhile, don’t get the same break.
For these owners, years of appreciation can be exposed to federal capital gains taxes of up to 20%, plus any applicable state taxes and, for some higher-income sellers, an additional net investment income tax.
Owners who used a home as a rental property and claimed depreciation can face an additional tax hit through depreciation recapture.
Each year, rental owners can deduct a portion of the building’s value to account for wear and tear, which can reduce taxable rental income while they own the property.
But when they sell, the IRS can tax the depreciation previously claimed through depreciation recapture.
Depending on where a homeowner lives and their income bracket, they can face tax rates as high as 25%.
Flock’s analysis combines those two liabilities into one punishing exit tax.
The analysis doesn’t suggest that every owner would face the same burden, or that every vacant home is being held for tax reasons; but it does show why, for some owners, selling doesn’t necessarily look like cashing out.
What the most affected markets share, says Realtor.com senior economist Hannah Jones, is years of appreciation, and in some cases, a property tax system that can keep annual holding costs low relative to current home values.
California is where those forces seem to be aligning most acutely.
The state accounts for six of the 49 metros identified in Flock’s analysis—the most of any state—and several sit near the top of the list.
Los Angeles had the longest break-even period of any market at 18.7 years.
In the City of Angels, the average exit tax was estimated at $185,054, compared with annual holding costs of $9,899.
The Bay Area shows the same basic pressure but with even larger tax bills.
San Jose had the highest average exit tax in the analysis, at $276,515, and a break-even period of 14.9 years.
San Francisco followed at $221,799, with a break-even period of 14.1 years.
San Diego also ranked near the top, with a break-even period of 14.5 years.
The average exit tax there was estimated at $167,527, while annual holding costs were $11,535.
Schmidt says she sees that dynamic play out firsthand.
“I am definitely seeing longtime San Diego owners hold on to vacant, underused, or former rental homes to avoid capital gains tax,” she says.
Even when owners or their children understand the risks of letting a property sit vacant—from squatters to deferred maintenance—they may still decide to hold because the tax hit from selling feels too large, she says.
“What these markets really have in common is two things, namely extreme appreciation and, in 4 of the [top] 5 cases, California’s Proposition 13 property tax cap, a combination that keeps the annual cost of holding a vacant home unusually low relative to what it’s actually worth,” says Jones.
“With California’s Prop 13, our property taxes only go up 2% per year, so for most of these longtime homeowners, their carrying costs are really not that high. The homes are paid off,” she says.
Florida and Texas also have similar protections and they both account for the second most metros with four each.
But even outside of protections like these, lower holding costs can produce the same result.
Salt Lake City—ranked second overall—is a prime example.
This affordability haven has a break-even period of 15.9 years, even though its average exit tax was $99,443—far below more costly California metros.
But while the tax bill is smaller, the annual cost of holding is also low enough that waiting can still look financially rational for a long time.
The same pattern shows up across parts of the Mountain West and Southwest.
Phoenix ranked fifth, with a break-even period of 14.4 years, an estimated average exit tax of $73,118, and annual holding costs of $5,061. Las Vegas also ranked in the top 10, at 13.1 years.
Despite the compelling math, the exit tax doesn’t necessarily explain every vacant home, says Jones.
“What this ranking is really picking up isn’t vacancy behavior, it’s the markets where the gap between what someone paid and what their home is worth today has grown the widest, which is exactly where the tax cost of selling hits hardest,” she explains.
But in a market so short on inventory, any reason not to sell can still matter.
Jones says that’s especially true in markets where active inventory is already structurally thin.
The exit-tax effect may be marginal in the aggregate, but it can still register if it affects the kind of existing-home supply buyers already struggle to find.
Schmidt says that’s the dynamic she’s seeing on the ground in San Diego, where some underused long-held homes represent rare entry-point opportunities for buyers willing to take on repairs.
“When the homes do come on the market, they are often in close to original condition, so these are homes that usually go to investors who then flip the properties. They would be good opportunities for buyers to build some sweat equity, but those buyers typically cannot compete with the all-cash buyers,” she says.
Start your day with all you need to know Morning Report delivers the latest news, videos, photos and more.
“So, we have a cycle in place of often poorly maintained homes being inherited, that are then bought by flippers, and sold for higher prices to residents,” she adds.
“I don’t know that I see this changing anytime soon, if ever.”
That’s why the exit tax matters beyond the owner’s personal calculations. In markets where selling is most expensive and waiting is cheapest, the tax code can reinforce the same bottleneck buyers already know too well: too few existing homes coming up for sale, too many arriving late, and prices that keep moving further out of reach.